Hello and welcome back to my multi-week series on COVID-19 in Verona and Essex County. Thank you all for your comments and insights about last week’s report. I am glad so many of you are finding it helpful and easy to understand. For those that shared your comments, I enjoyed reading them!
I’ve had a call to change the name of this series to “Corona in Verona” and the rhyme does sound catchy. But four people in Verona have already died from COVID-19 and 2,805 people have died from it across the state. Many of us already know a COVID-19 victim. It’s just not something we want to take lightly or joke about.
As always, this report is meant to present easy-to-understand data on COVID-19 for those who are interested. I am not a doctor, nor am I a public health expert or official, and as a result cannot provide anything more than what the data says. For any questions on COVID-19, resources available, and emergency needs please refer to New Jersey’s state webpage on COVID-19, which can be found here.
If you missed last week’s report, or want to refresh yourself on the findings, you can read it here.
Now, let’s get to the data. Our data are provided to MyVeronaNJ by the Essex County Department of Health and Rehabilitation. Data comes to MyVeronaNJ as of 9 a.m. and as of 5 p.m., daily. For the purposes of these reports, MyVeronaNJ will be using data available as of 5 p.m. for the days reported on.
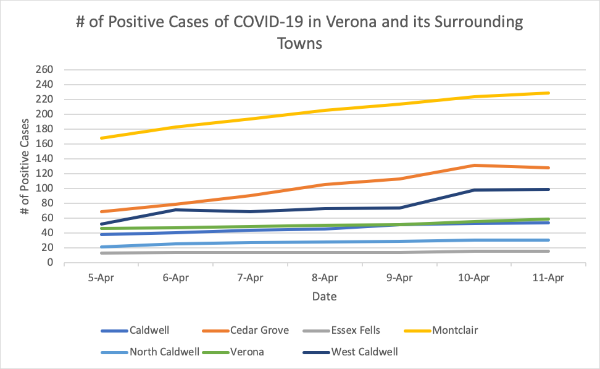
Looking at Figures 1 and 2, we see the number of positive cases of COVID-19 for Verona and its immediate surrounding towns by number of positive cases and number of positive cases per one thousand residents, respectively. As seen in Figure 1 above, the week started out again with the highest number of positive cases in Montclair, which had 168 positives. Between March 29 (64 positives) and April 5, Montclair saw a 162.5% increase in the number of positive cases. The lowest number of positives was in Essex Fells which had 13. Between March 29 (6 positives) and April 5, Essex Fells saw a 113.67% increase in the number of positive cases. Finishing the week, Montclair still had the largest number of positive cases with 229, however Essex Fells had only 15 by the end of the week, keeping it at the bottom of the surrounding municipalities. Verona consistently remained in the middle with 46 positive cases in the beginning of the week and 59 by the end. Verona’s percentage increase in its number of positive cases between March 29 (10 positives) and April 5 is 360%. From the beginning to the end of the week, Verona saw a 28.3% increase in its number of positive cases.
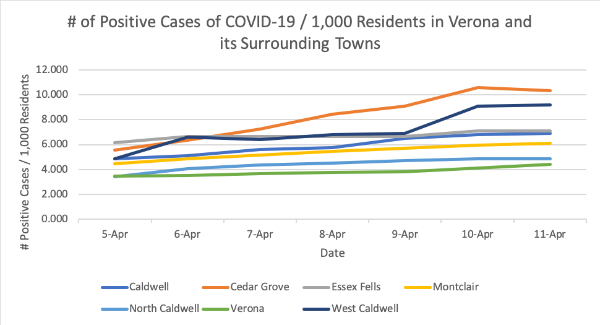
Figure 2 shows a different picture and the changes from last week are quite interesting. In terms of number of positive cases per 1,000 residents, Essex Fells still remained the highest in the start of the week with a ratio of 6.152. It is seen, however, that Cedar Grove overtook Essex Fells by the end of the week with a ratio of 10.313 positive cases per 1,000 residents. Cedar Grove started the week with a ratio of 5.560. By the end of the week, Essex Fells finished in third with 7.099 positive cases per 1,000 residents, and West Caldwell finished second highest with a ratio of 9.202.
Verona and North Caldwell both started out the week nearly tied for the lowest ratio having starting ratios of 3.450 and 3.396, respectively. Good news for Verona residents, we finished the week continuing to have the lowest ratio at a value of 4.425 positive cases per 1,000 residents. North Caldwell finished up the week having a ratio of 4.852.
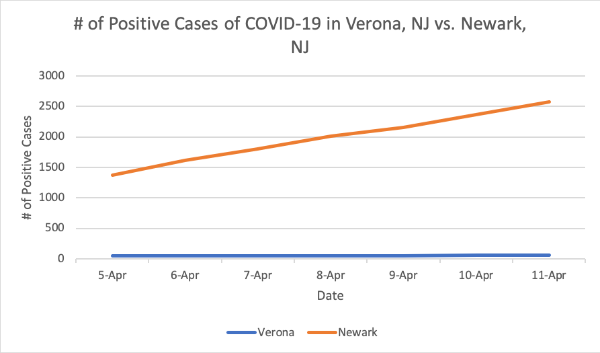
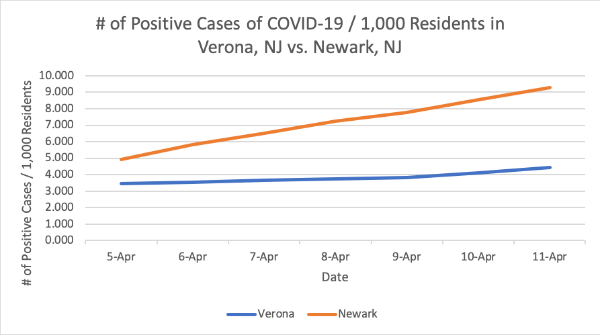
Lastly, one more important graph to look at is how Verona is stacking up against Newark, one of Essex County’s hardest hit cities by COVID-19. In Figure 3, the number of positive cases in each city is graphed, and as can be seen, Newark continues to have a much higher cumulative number of positive cases than Verona. On April 5, Newark had 1,368 positive cases while Verona only had 46. On April 11, Newark had 2,575 positive cases while Verona had 59. Newark saw an 88.2% increase in their number of cumulative positive cases. Verona saw a 28.3% increase in its cumulative positive cases. In terms of the number of positive cases per 1,000 cases, the gap between Verona and Newark has widened for this week. Newark started out the week having a ratio of 4.936 positive cases per 1,000 residents, while Verona started at 3.450. By the end of the week, Newark finished with a ratio of 9.291 whereas Verona finished with a ratio of 4.425.
Just like last week reminded us to not forget about the good, this holds true this week. As of April 11, there were 4,839 tests that came back negative across all of Essex County, and hopefully we will see this number increase as more people are tested. Together, as a town and a community, we will survive this and when everything is over we will come out stronger and more resilient than ever!
Check back next Tuesday, April 21 for the next report covering April 12 – April 18. As always, if there is anything you’d like to see just let me know!
